Using a line graph
Only use lines to connect data points together if the data points are connected to one another. This typically means change over time.
For example, the price of a pear in 1996 and 1997 are related, so you can draw a line between those two data points. The price of a pear and the price of a grape are not related, so you cannot draw a line between those two data points.
Example
Using a line graph for the number of people who go to the hospital every day is fine, because each day is related to the day before and the day after.
If you're graphing the 2014 GDP of various countries, a line graph will not work. Pakistan's GDP is not related to Chile's GDP, so you use a bar graph to keep the data points separate.
One after the other is not always change over time
It can be tricky, though! Let's say you have a collection of mass shootings, and you'd like to graph graph of how many casualties occurred in each. The shootings happened one after each other, yes, but they aren't actually connected to each other, so you can't use a line to connect them (you'd use bars instead).
If you grouped them by year and counted casualties annually, though, you could use that new data to draw a line between 2000 and 2001 and 2002 - just not if you just have a series of individual data points.
Smoothing out jagged lines
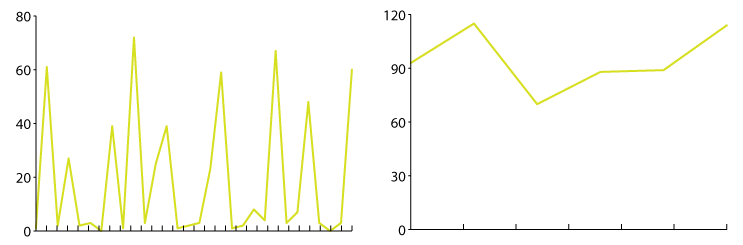
If you're graphing something over time and the lines are jumping up and down a lot, you should try resampling the data across a larger range, for example using weeks instead of days. No one can read a jagged line, and if they can they don't enjoy doing it!
If you can't combine the individual data points, it might be best to use bars instead of lines.
Example
For example, let's say I'm graphing the money I spend on groceries every day. Since I don't grocery shop every day, the line is going to be very very erratic - usually $0, but sometimes it will jump up to $20 or even $150. If I graphed my grocery spending on a weekly or monthly basis, though, it would even the line out.
Even though the original daily graph has more raw information, the way it's presented made the graph less informative.
Plotting dots on your lines
Only use dots on your lines when each specific data point is important. Otherwise they're just clutter - if you have a lot of data or are just interested in general trends, the lines are usually enough by themselves.
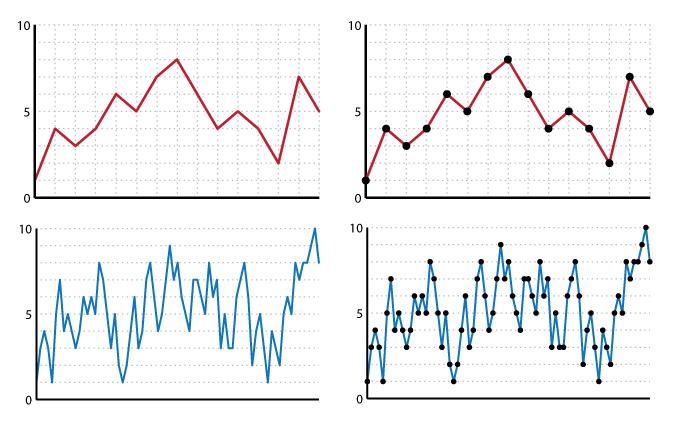
As you can see, more data = less clean.
If you're on the fence about whether to dot or not, read about backgrounding on line graphs for tips on how to use dots but make them subtle enough to get the best of both worlds.
Backgrounding data dots on lines
If you're plotting dots on your lines, you have two options for coloring your dots:
- If the line is more important than the data point or you're trying to background the dots, color each dot the same color as the line it is on. This is cleaner-looking.
- If the data point is more important than the data point, color each dot black or dark grey. This is more data dense.
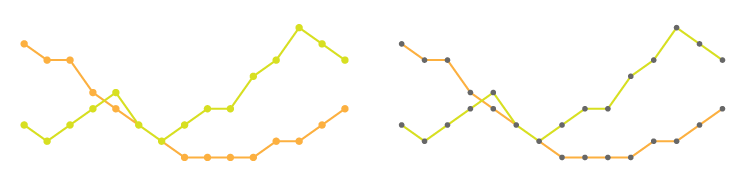
This is unusual in that grey usually backgrounds data - on a line graph with colored lines, though, it makes them stand out. To background you really need to match colors with the lines themselves.